UPGRADES
Welcome to this month’s “Upgrades” update.
This is something “new” that I use myself and decided to share. It works for me in this format, but I welcome suggestions for any improvements which may make it better for everyone else, so let me know in the comments below…
INTRODUCTION
Broker upgrades, to Earnings Per Share (EPS), are something I check for pretty much every morning.
Upgrades typically come in the day, or a few days, after an “ahead” or favourable statement by a company. Quite often, thanks to Research Tree, I get to have an idea of the affect these statements will have on EPS forecasts on the day. However, not all companies provide us Private Investors with such information, so it’s usually a case of waiting to see the impact reflected in the Stockopedia forecasts. I always consider it useful to watch out for those updated forecasts on Stockopedia.
I have a simple Stockopedia screen that identifies all companies that have had a Y1 EPS upgrade greater than 5% in the past month. From this screen, I export the data into Excel and manipulate it so it looks like this.
Companies in my universe (as with “Bowls”), included in the above screen, are those with a Market Cap greater than £50m and less than £1.5bn. I exclude those in the “Residential & Commercial REITs”, “Collective Instruments” or “Holding Companies” Industry groups – Just my personal choice which leaves me with around 500 “Companies In My Universe”.
Here I can quickly identify…
Companies with a Y1 EPS upgrade greater than 5% in the past month (Dark Green)
Companies where Y2 EPS has also been upgraded in the past month (Dark Green), it’s good to see both years upgraded is it not!
The relative performance (strength) of the Share Price in the past month, Dark Green highlights those where that performance is less than the Y1 EPS upgrade (percentage)
The forecast growth from the Y1 EPS forecast to the Y2 EPS forecast, Dark Green highlights those where there is growth, it’s good to see growth is it not!
The forecast PER’s for Y1 and Y2
The Y2 PEG, which is Not Applicable (n/a) if there is no growth forecast (from Y1 EPS to Y2 EPS), Dark Red if it’s greater than 1 (no real value*), Green if between less than 1 and greater than 0.75 (some value*), Dark Green if between 0.75 and 0.25 (THE SWEET SPOT FOR VALUE*), Green if less than 0.25 (could be great value but probably indicates something is not quite right*)
* Observations based on my interpretation of PEG, which you may or may not agree with, and which is of course not applicable to all shares.
IMPORTANT NOTE – Some of the above EPS are not in Sterling, I have yet to find a simplified way to identify and convert non-Sterling EPS forecasts to Sterling. I am hopeful to have this done by next month, for now this is more of a share it and get feedback, before hopefully having better versions of the report next month, and from the start of next year.
So, it would be nice to identify, would it not…
Companies with a Y1 EPS upgrade greater than 5% in the past month (Dark Green)
Companies where Y2 EPS has also been upgraded in the past month (Dark Green)
Companies where the relative performance (strength) of the Share Price in the past month has not yet caught up with the new forecasts (Dark Green)
Companies where growth is forecast from Y1 EPS to Y2 EPS (Dark Green)
Companies with a Y2 PEG in the “SWEET SPOT”, between 0.25 and 0.75 (Dark Green)
Well, that’s what this speadsheet gives me.
As luck would have it, this month nothing meets all of the criteria above, so maybe not a great month to start sharing this!
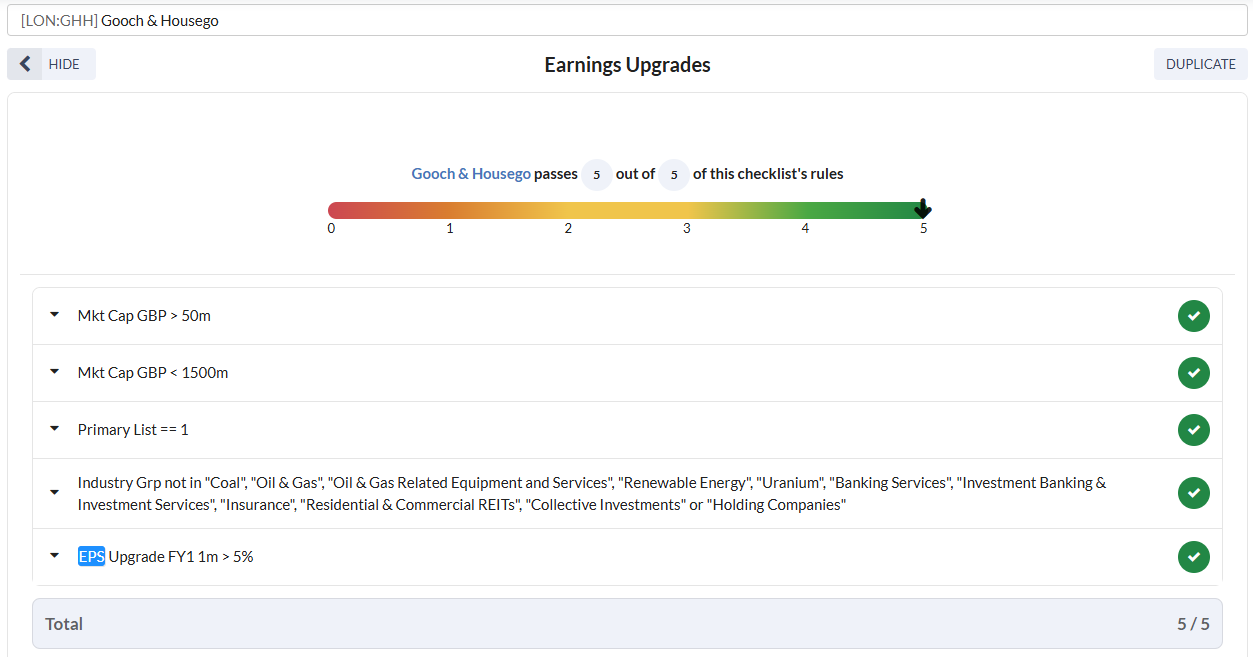
The closest company to meeting the criteria would probably be GHH. The PEG is 0.22, which is not ideal as it indicates (to me) something could be wrong here, and there was no upgrade to Y2 EPS in the last month (but at least it held flat). Nonetheless, it’s probably worth a look, as are maybe others that are close to meeting most of the criteria.
Anyway, food for thought and with your feedback, hopefully I can make this something more of you can rely on and use in the future.
SUMMARY
I may hold all, some, none, of the stocks mentioned in this article.
No investment advice intended, for information only, Do Your Own Research.
Do please give feedback on this so I can make it more useful to as many of you as possible going into the new year.
Until next time!
Jon


I like what you have done here. my thoughts would be score the better ones green, and orange for the rest . maybe add what the institutions may be doing ? adding or selling same as insiders.. eventually a scoring system figures who are the best of the best .maybe even a technical pattern could provide conviction for scoring .you can’t buy them all can you.
BU,
Any chance you can share the screen you use on Stockopedia please? I am also a subscriber, so would appreciate being able to view an Upgrade Screen. Also want to learn a bit more about exporting information and figures to Google sheets or Exel to monitor companies, especially some of my own portfolio.
Thanks for any assistance.
Kind regards,
Graham.